AUD/CAD Seasonality®: Date-Bound Alpha From Oct 17 to Nov 15
- Sagar Chaudhary

- Oct 16, 2025
- 7 min read
By Sagar Chaudhary
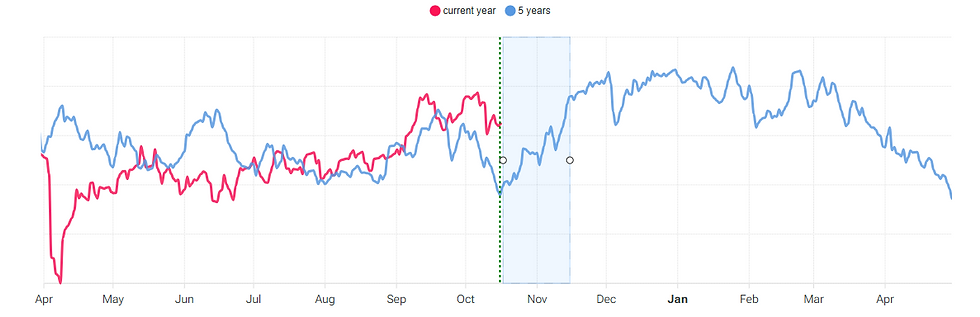
The seasonality panel for AUD/CAD (window Oct 17 to Nov 15) shows a 5-year correlation of ~82% to a rising pattern, with our broader table study indicating an ~80% win rate and ~2.3% average gain over the same dates. In simple terms: this has been a repeatable, modest but reliable long in recent years. The blue line (5-year composite) climbs through late October and the first half of November; the current year (red) tracks the composite fairly well into October, which increases the probability that the typical lift can express again—provided we control risk and avoid over-sizing.
The core idea: buy AUD/CAD on a date-bound schedule, build in tranches, trail by volatility, and flatten on Nov 15 regardless of how “good” it looks. We’re not forecasting the world; we’re extracting a historically repeatable window.
What the chart is telling us
Window: The UI highlights Oct-17 to Nov-15 with a vertical green start marker and a shaded exit zone.
Composite behaviour (blue): Over the last five years, AUD/CAD tends to pivot off October lows and grind higher into mid-November. The slope is not explosive; it’s a steady staircase.
Current year path (red): The red line oscillates around the composite through mid-year and is not materially diverging heading into October. When the current year is “cooperative” rather than in outright opposition, seasonal edges tend to transmit more cleanly.
Correlation meter: 82.03% (5 years). For a cross that embeds two commodity currencies with different drivers (iron ore/China for AUD, crude oil/North America for CAD), an 80%+ alignment is a strong signal of behavioural regularity across this fixed calendar slice.
Why November favours AUD over CAD (the intuitive macro)
Seasonality doesn’t need a narrative—but if there is a sensible backdrop, confidence improves:
China impulse → AUD beta. Late Q3/early Q4 often brings infrastructure spend headlines, steel output adjustments, or liquidity nudges from China. AUD—levered to iron ore and coal—captures that risk-on tone faster than CAD does.
Oil seasonality cools off. CAD benefits from crude strength, but the autumn refinery maintenance period and demand transitions can cap upside for oil into November. If oil stalls while China-sensitive materials perk up, AUD/CAD lifts.
Policy cadence. The RBA (first Tuesday of November) and BoC (late Oct/early Nov) meetings frequently re-anchor rate differentials. A neutral-to-hawkish RBA vs. a balanced BoC can skew carry/support to AUD/CAD during this exact window.
Risk appetite. Into year-end, portfolio re-risking and commodity curves can favour higher-beta AUD over more oil-tethered CAD. The pair expresses relative commodity optimism without the USD.
You do not need all four to line up. Seasonality suggests that, on average, enough of them do—often enough to generate a gentle but tradable drift.
The stats that matter (and how to read them)
Correlation (5y): ~82% → The pattern’s shape repeats across years.
Win rate (multi-year): ~80% → Four out of five years green.
Average move: ~2.3% → A campaign move, not a day trade.
Window length: ~30 days → Plenty of noise; you win by position management, not surgical entries.
Interpretation: This is not a “home-run” pair. It’s a high-probability, medium-magnitude seasonal. The right behaviour is patient compounding: build, sit, trail, and close on schedule.
Portfolio role
Diversifier: As a cross (no USD in the quote), AUD/CAD can balance USD-centric books.
Commodity-relative expression: You are long “China/iron ore optimism minus oil strength”.
Volatility profile: Typically lower realized vol than AUD/JPY or AUD/USD. Good core position to anchor a seasonal basket.
The campaign blueprint (copy-paste rules)
1) Universe and timing
Pair: AUD/CAD (spot or CFD)
Dates: Enter from Oct 17 (T0), exit on Nov 15 (EOD)
Build: 3 tranches (T0, T0+1–2, T0+4–5) to reduce timing risk.
2) Sizing (volatility-normalized)
Compute ATR(14-day) in pips.
Initial risk per tranche: 0.25R (so 3 tranches = 0.75R max initial).
Total planned risk for the idea: 1.0–1.25R including room for one add-on if momentum confirms.
Position formula:Units = (Account_Risk_per_Tranche) / (ATR_pips × Pip_Value)
This equalizes contributions regardless of momentary volatility spikes.
3) Entries
Tranche 1 (T0): Market or limit within 0.3× ATR of daily open.
Tranche 2: Add if price closes above entry and is +0.6× ATR from Tranche-1 average; else add on calendar (T0+2) but at half size.
Tranche 3: Same logic as Tranche-2, or calendar add by T0+5. The point is to be in without playing perfection.
4) Risk and exits
Initial stop (for each tranche): 1.0× ATR below tranche entry.
Campaign stop (composite): Once blended P&L reaches +1.5× ATR, raise a trailing stop = 0.8× ATR behind price.
Scale-out rule: At +2.5× ATR from the blended entry, bank 1/3.
Hard time exit: Close everything on Nov 15 EOD—even if it “still looks good.” Seasonality edges decay quickly outside the window.
5) Kill switches (portfolio level)
If the basket of seasonal trades (not just AUD/CAD) is −2R before Oct 27, trim satellites first and reduce AUD/CAD risk by 30%.
If the basket is +3R by Nov 1, pay yourself (withdraw 25–33% of unrealized gains across positions) and tighten all trails by 0.2× ATR.
Scenarios and responses
A) Base case (most likely): Quiet grind higher
Price wanders, respects ATR bands, picks up pace after RBA/BoC.
Action: Complete tranches, trail at 0.8× ATR, take the +1/3 scale at +2.5× ATR, aim to hold remainder to time exit.
B) Positive surprise: China/iron ore strength + soft oil
AUD pops; CAD lags as crude drifts.
Action: Allow momentum add-on (one extra 0.25R) only if blended P&L > +1.0× ATR and daily close breaks a 20-day high. Tighten trail to 0.7× ATR.
C) Risk wobble: Oil spikes or BoC hawkish
CAD gains on oil; AUD stalls.
Action: Keep the initial stop discipline. If two consecutive daily closes under the 10-day EMA while you’re below +0.5× ATR P&L, pause further adds and keep trails wide until either stop or recovery.
D) Regime break: Red line diverges hard from composite
The current year path crashes below the 5-year template (e.g., China shock).
Action: Accept the time-based “no trade” outcome if Tranche-1 hits stop quickly and correlations crumble. Remember: seasonality ≠ obligation. Capital saved is capital compounding later.
Why we avoid over-fitting
You’ll notice this plan does not rely on minute oscillators, pattern names, or bespoke filters. There are reasons:
Robustness beats precision. A date-anchored edge with stable stats is more reliable than a hyper-optimized indicator cocktail that dies out-of-sample.
Transaction cost control. One campaign → a handful of tickets, not dozens.
Behavioural clarity. You know exactly when you’re done: Nov 15. No bargaining with the market.
If you want an overlay, use two light confirms only:
Daily close above a 10-day EMA at entry adds confidence.
RSI(14) not overbought (>70) on the first two tranches reduces the odds that you chase a spike.
Event map (what can jolt the pair inside the window)
BoC rate decision / MPR (late Oct): A hawkish tilt boosts CAD; watch for oil linkage.
RBA (first Tuesday of Nov): Any surprise hawkishness supports AUD; neutral is fine.
Aus CPI (late Oct; monthly/quarterly timing): Inflation upside lifts AUD expectations.
China PMIs (month-end/early month): Beats → AUD tailwind.
Canadian jobs (first week of month): Strong prints can support CAD, but the seasonal drift often survives single data shocks if risk is controlled.
Oil/iron ore price swings: Keep a glance at front-month curves; violent divergence (oil +, iron ore −) is a warning to lighten up.
You don’t need to predict these, just know when they occur and avoid oversized risk going into them.
Trade examples (hypothetical mechanics)
Assume ATR(14) = 0.0080 (80 pips) and account risk R = 1% of equity.
Tranche 1: Risk 0.25R. Stop 80 pips. If pip value is, say, ₹X per pip per standard unit, size = 0.25R / (80×₹X).
Tranche 2: Add on +48 pips (0.6× ATR) or T0+2 at half size.
Tranche 3: Same logic, completed by T0+5.
Trail: When blended P&L ≥ +120 pips (1.5× ATR), set trailing stop at 64 pips (0.8× ATR).
Scale: At +200 pips (2.5× ATR), take off one-third.
Numbers will vary, but the structure holds.
Frequently asked questions
Q: Why not use AUD/USD or CAD/JPY instead?A: AUD/CAD isolates relative commodity beta without USD’s macro gravity or JPY’s funding-risk whips. It’s a calmer ride for a calendar trade.
Q: What if oil rips higher?A: That is CAD-positive. Your ATR stop and trailing rules manage the downside. If oil strength is the only theme pushing CAD, the drift can still resume once the impulse cools.
Q: Can I hedge with oil or iron ore directly?A: You can, but hedging a relative cross with absolute commodities often over-complicates risk. If you must, use tiny overlays (e.g., reduce exposure by 20–30% instead of constructing a full hedge).
Q: Should I pyramid aggressively?A: No. The edge here is probability plus time, not magnitude. Respect the +1/3 scale-out and hard exit date.
Mistakes to avoid
Oversizing a gentle edge. It’s tempting to “size up” because of the win rate. Don’t. Keep 1.0–1.25R total risk for the idea.
Ignoring time. The power is the window. If you keep it past Nov 15 because “it still looks good,” you’ve abandoned the system.
Stacking too many AUDs. If you also run AUD/USD and AUD/JPY, recognize you’re building the same exposure. Balance with AUD/CAD as the core and keep the others as satellites.
Trading the news. The rules already account for volatility. Don’t override them reactively.
How this fits inside a broader seasonal basket
In the same Oct-17 → Nov-15 window, we observed strong or useful long biases in NZD/USD, AUD/JPY, NZD/JPY, EUR/GBP, and USDCAD. Think of AUD/CAD as the spine—a clean, non-USD expression. Use EUR/GBP for ballast, AUD/JPY/NZD/JPY for momentum (with tighter trails), and USDCAD to neutralize net USD if you add AUD/USD or NZD/USD to the mix.
A minimalist checklist for execution
Compute ATR(14), pip value; size tranches (0.25R each).
Place alerts: +0.6× ATR (add), −1.0× ATR (stop), +1.5× ATR (activate trail), +2.5× ATR (scale 1/3), Nov 15 exit.
Stage entries on Oct 17 / 18–19 / 22 (or similar).
Don’t add on down-days unless calendar forces a half-size second tranche.
Manage portfolio kill-switches (−2R basket trim; +3R basket pay-yourself).
Flatten all positions Nov 15 EOD. Done.
Closing perspective
You don’t need a heroic forecast to make money here. You need discipline around a modest, repeatable edge:
A 5-year, ~82% seasonal correlation that favours AUD over CAD in late October through mid-November.
A measured win rate (~80%) with an average ~2.3% campaign move.
A date-bound plan with vol-normalized sizing, trailing risk, and non-negotiable exit.
That’s professional trading: Evidence → Exposure → Execution—then flat. Count the R, move on to the next edge.


Comments